
Thank you for joining us in a weekly technical look at the mid-cap oriented INK Canadian Insider (CIN) Index. Last week, the INK CIN broke through its multi-month trading range, powering 47.21 points or 5% higher. The Index closed at 971.26.
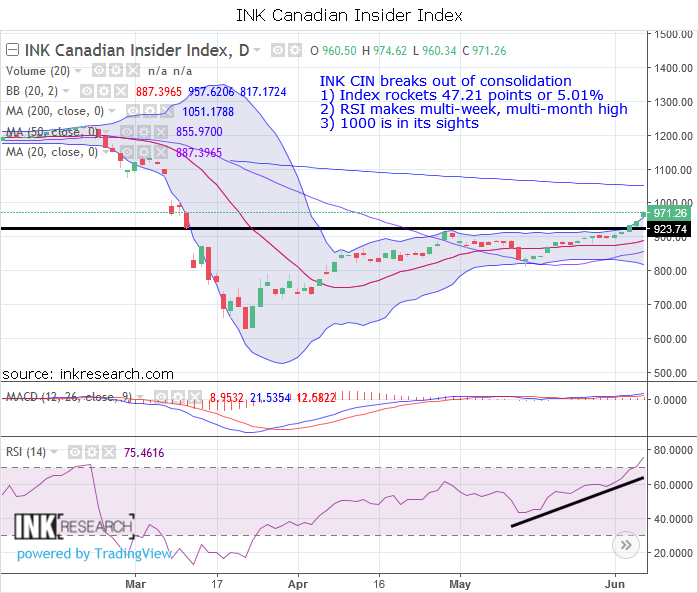
MACD nearly doubled, rising 4.32 points to 8.95. RSI shot up 16.59 or 35.5% to 75.46, notching a multi-week and multi-month high.
Support is at 887 (20-day moving average) and 930. Resistance is at 957 (upper Bollinger band) and 971.
As far as performance goes, the INK Canadian Insider Index outperformed the SPDR S&P 500 ETF (SPY*US) (4.94%), gold (-3.92%), and silver (-5.51%) but trailed copper (5.36%) and red-hot crude oil (11.44%).
What is next for stocks, bonds, and gold? The INK CIN Index quarterly presentation explains how inflation expectations could well determine the winners and losers in markets with major implications for Canadian stocks. Watch the presentation on Ultra Money Free here.
The INK Canadian Insider Index is used by the Horizons Cdn Insider Index ETF (HII).
No Comments