
Thank you for joining us in a weekly technical look at the mid-cap oriented INK Canadian Insider (CIN) Index. Last week, the INK CIN took a spirited run at the 1,000 level but ran into heavy resistance at 992-993. Ultimately, it was then yanked downward along with correcting US markets and fell 40.95 points to close at 930.31 for a loss of 4.2%.
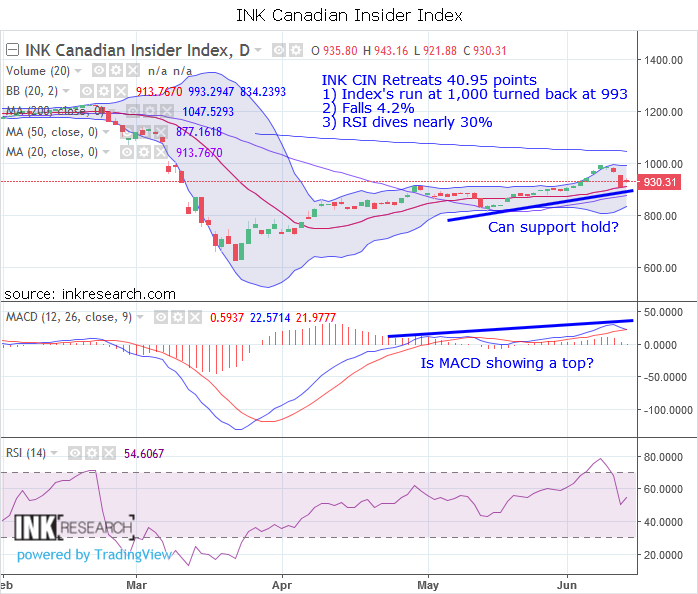
MACD sunk 8.35 points to 0.43. A week after establishing both multi-week and multi-month highs, RSI slipped 20.86 points to 54.60 for a decline of 27.6%.
Support is at 877 (50-day moving average) and 913 (middle Bollinger band). Resistance is at 993 (upper Bollinger band) and 980.
As far as performance goes, the INK Canadian Insider Index outperformed the SPDR S&P 500 ETF (SPY*US) (-4.75%) and plunging crude oil (-8.32%) but lagged gold (3.23%), copper (1.74%), and silver (0.02%).
The INK Canadian Insider Index is used by the Horizons Cdn Insider Index ETF (HII).
jordan release date | Nike Air Max 270 - Deine Größe bis zu 70% günstiger
No Comments