
Thank you for joining us in a weekly technical look at the mid-cap oriented INK Canadian Insider (CIN) Index. Last week, the INK CIN slipped heavily falling 33.8 points or 3% to 1093.35.
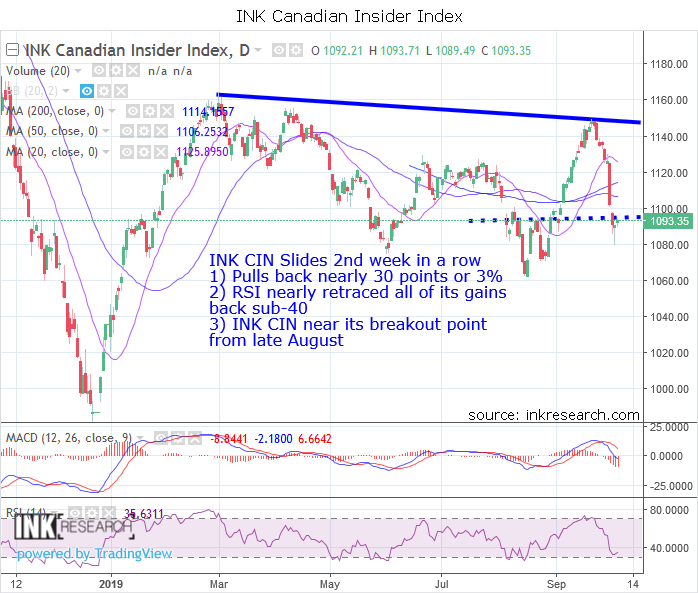
MACD plunged 6.8 points to -8.8. RSI fell 18.3 points or 34% to 35.3.
Support is at 1090.36 (lower Bollinger band) and 1080 (which the Index hit and rebounded from). Resistance is now at 1100 and 1120.
The INK Canadian Insider Index outperformed oil (-5.5%) but trailed gold (+0.43%), silver (-0.15%), the SPDR S&P 500 ETF (SPY*US) which was down -0.36%, and copper which fell 1.35%. The INK CIN is back to retest the area it broke out from in late August, so it finds itself at a key juncture after its second weekly loss in a row. On the bull side of the equation, I am seeing some positive divergence on copper's chart, something that could foreshadow a rally in inflationary assets and US Markets, both of which have very poor sentiment right now.
The INK Canadian Insider Index is used by the Horizons Cdn Insider Index ETF (HII).
Adidas footwear | Supreme x Nike Air Force 1 Low 'Box Logo - White' — Ietp
No Comments