
Thank you for joining us in a weekly technical look at the mid-cap oriented INK Canadian Insider (CIN) Index. Last week, the Index dipped to start the week, pulling back to its lower Bollinger band at 1230.48 before bouncing and getting further spring off its 200-day moving average near 1238. The Index then shot as high as 1266.54 before into week's end. By then, it held a gain of 1.57 points, finishing at 1252.67.
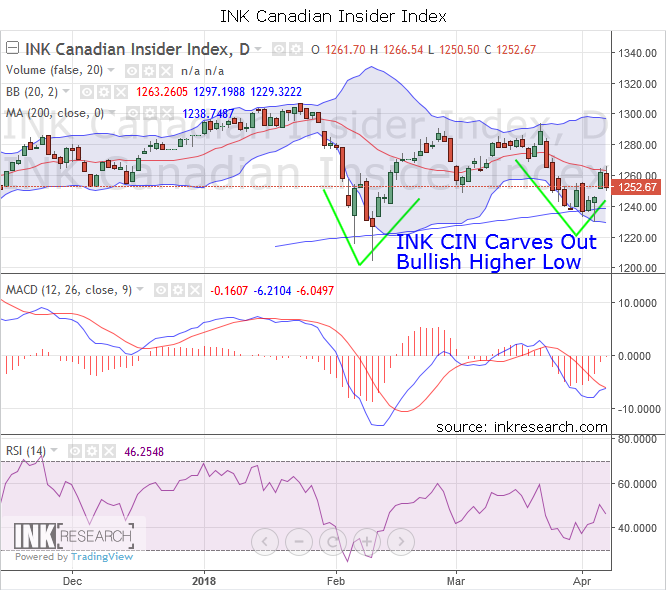
Support is at 1229.32 (lower Bollinger) and 1238.75 (200-day moving average). Resistance is at 1267 and 1270.
RSI rose 3.75 points to 46.25, while MACD rose 4.84 points to -0.16.
The INK CIN is currently carving out a higher low than it did during its February bottom and recovery. This is typically a bullish pattern, suggesting sellers are weakening and buyers are more eager. That said, the Index will need to further confirm and build upon its recent strength by breaking above its 50-day moving average into the 1270s. One bullish note for the Index is that it has outperformed the S&P 500 by 2% over the past 90 days.

