
Thank you for joining us in a weekly technical look at the mid-cap oriented INK Canadian Insider (CIN) Index. After we published our final technical review of the year on Dec 15th, the INK Canadian Insider Index rallied 25 points or 2.1% on the way to a brand new 2019 intraday high at 1190.53 (and closing high of 1189.66) before entering a corrective trend. The Index closed last week down 7.41 points to 1182.25.
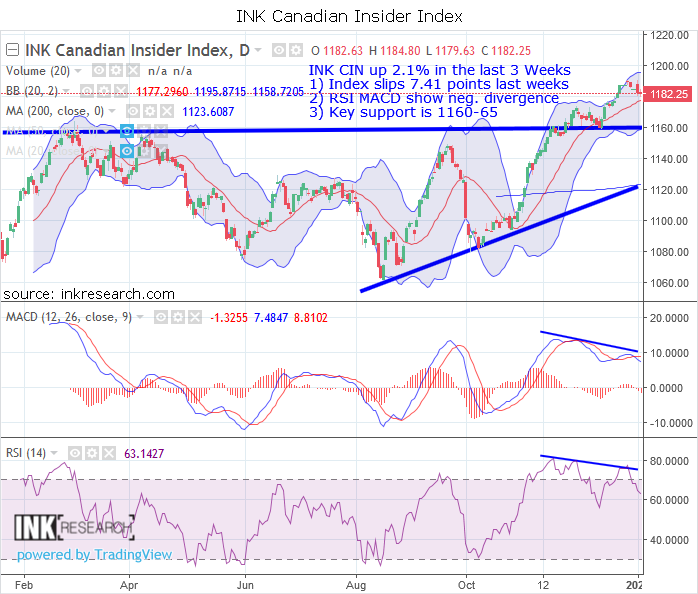
MACD dropped 2.4 points to -1.33. RSI fell 8.58 to 63.14.
Support rests at 1160 and 1165. Resistance is at 1190 and 1195.87 (upper Bollinger band).
As performance goes, the INK CIN bested copper (-1.4%) but trailed crude oil (2.15%), gold (2.26%), silver (1.16%), and the SPDR S&P 500 ETF (SPY*US) (-0.14%).
Since our last update where we speculated on the likelihood of a resource sector uptrend powered by low rates, both commodities and resource stocks have rallied strongly, and, not surprisingly, the INK CIN has been a beneficiary. With geopolitical tensions high to start the week, we could see some weakness for markets over the next few days. In addition, I have noted some negative divergence in both MACD and RSI (down-sloping blue lines) suggesting some weakness to come for the Index. INK CIN bulls would like to see the solid 1160-1165 support area hold on any pullback.
The INK Canadian Insider Index is used by the Horizons Cdn Insider Index ETF (HII).
No Comments