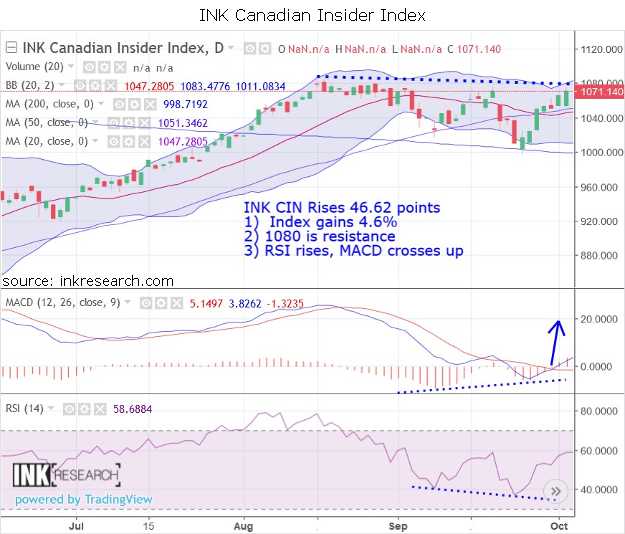
Thank you for joining us in a weekly technical look at the mid-cap oriented INK Canadian Insider (CIN) Index. Last week, the Index shot up 46.62 points or 4.6% to close the week at 1071.14 points.

Momentum indicators remain volatile. MACD rocketed back up to 5.15 and triggered a new buy signal. RSI rebounded 15.5 points to 58.69.
Support is now at 1047.58 (lower Bollinger band) and 1051.34 (50-day moving average). Resistance is at 1080 and 1083.48 (upper Bollinger band). 1080 is key resistance level as it has capped the Index since mid-August.
As far as performance goes, the INK Canadian Insider Index beat rebounding copper (+3.91%), gold (-0.45%), the SPDR S&P 500 ETF (SPY*US) (-0.96%), and crude oil (-4.31%).
As I noted last week’s blog, the Index pierced the lower Bollinger band and generated a strong reversal move in response. I am still looking for an upside reversal in gold and silver around October 7 (give or take 2-3 trading days). If we get that strong upside move, then we might see the INK CIN take a run at 1800 and perhaps, finally break through.
The INK Canadian Insider Index is used by the Horizons Cdn Insider Index (HII).
Nike Sneakers | Converse Chuck 70 National Parks - Red Bark / Malted / Gold Dart – Spartanova

No Comments