
Thank you for joining us in a weekly technical look at the mid-cap oriented INK Canadian Insider (CIN) Index. Last week, as US markets corrected, the Index finally followed its recently weakening RSI momentum indicator. The INK CIN tumbled 31.71 points or 3% to 1039.80.
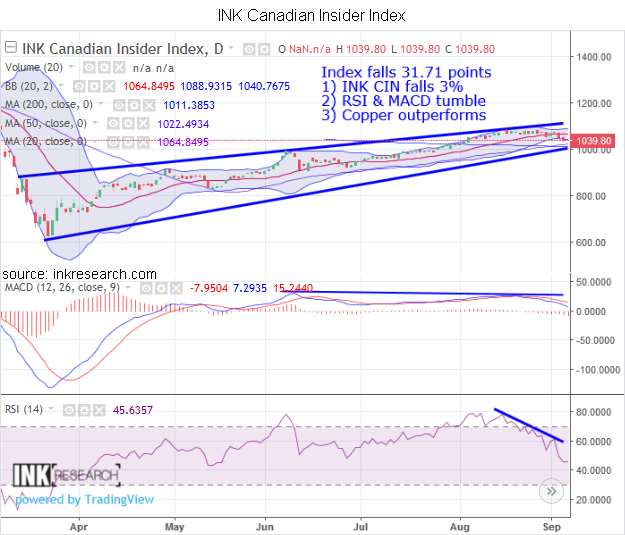
MACD sunk 3.93 points to -7.95. RSI fell 18.03 points to 45.63.
Support is now at 1040.77 (lower Bollinger) and 1022.49 (20-day moving average). Resistance is at 1050 and 1064.85.
As far as performance goes, the INK Canadian Insider Index beat silver (-3.88%) and sluggish crude oil (-7.45%) but lagged gold (-2.06%), the SPDR S&P 500 ETF (SPY*US) (-2.28%), and inflation-anticipating copper (1.41%).
The INK CIN has pierced its lower Bollinger band on last week's tumble, and this makes it a candidate to enjoy a bounce soon.
The INK Canadian Insider Index is used by the Horizons Cdn Insider Index (HII).
No Comments