
Thank you for joining us in a weekly technical look at the mid-cap oriented INK Canadian Insider (CIN) Index. Last week, the Index rose another 26.35 points for a 2.1% gain as it closed at 1264.86. The INK CIN has now rocketed an impressive 18.9% over the past 5 weeks.
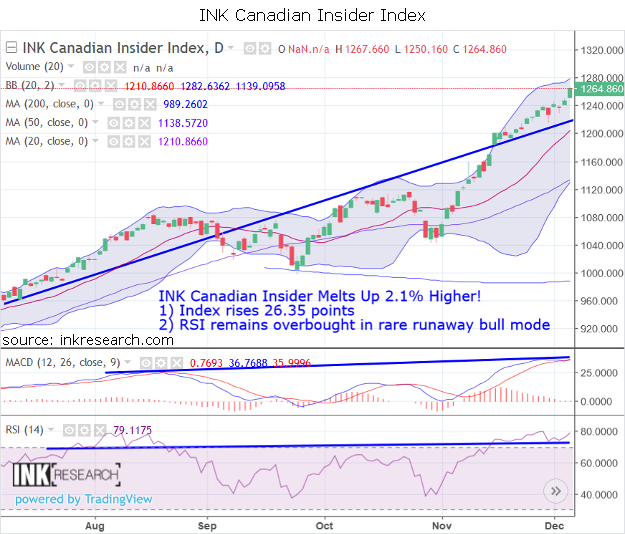
Long-term momentum indicator MACD dropped 2.6 points to 0.77.
Our short-term momentum indicator, RSI, dipped 1.14 points and remained overbought at 79.11 points. It is rare that RSI gets overbought and stays overbought but this can happen when a market enters a powerful bull cycle. That is what is happening now with the INK CIN and we are also seeing it in various sectors like oil, copper, platinum, and uranium.
Support is at 1200 and 1220. Resistance is at 1282 (upper Bollinger band) and 1270.
As far as performance goes, the INK Canadian Insider Index beat oil (+1.6%) and the SPDR S&P 500 ETF (SPY) (1.7%) but lagged gold (+2.9%), silver (+7.3%), platinum (+11.19%), and copper (+3.13%).
The INK CIN remains in a powerful bull market mode and as long as RSI persists at high levels, the Index can continue to move higher.
The INK Canadian Insider Index is used by the Horizons Cdn Insider Index (HII).
No Comments